Topology - DSS 6 | Data Source Solutions Documentation
Documentation: Topology - DSS 6 | Data Source Solutions Documentation
Topology
The Topology page displays intuitive visual elements to provide multiple key attributes of every data flow in a single overview, including:
- Direction of the data flow in a channel
- Relative number of tables being replicated per node
- Indication of latency, split between Change Data Capture (CDC) and integration
- Indication of whether latency thresholds are exceeded, split by capture and integration
Topology provides live reports giving you deeper insights on data movement, as well as drilling down into the historical metrics per data flow/channel. Locations and channels displayed on the Topology page are color-coded based on the data volume and latency. Locations or channels alerting red can be immediately clicked into for diagnosis and troubleshooting.
In Topology, clicking a specific location or channel opens a live status card related to that specific location or channel.
Viewing Topology
Topology can only be launched from the user interface in a web browser. To open the Topology page, navigate to the left sidebar and click ![]() TOPOLOGY.
TOPOLOGY.
The Topology view contains the following user interface elements:
The look and feel of the topology visualization may be customized on the Topology Preferences pane of the User Preferences page.
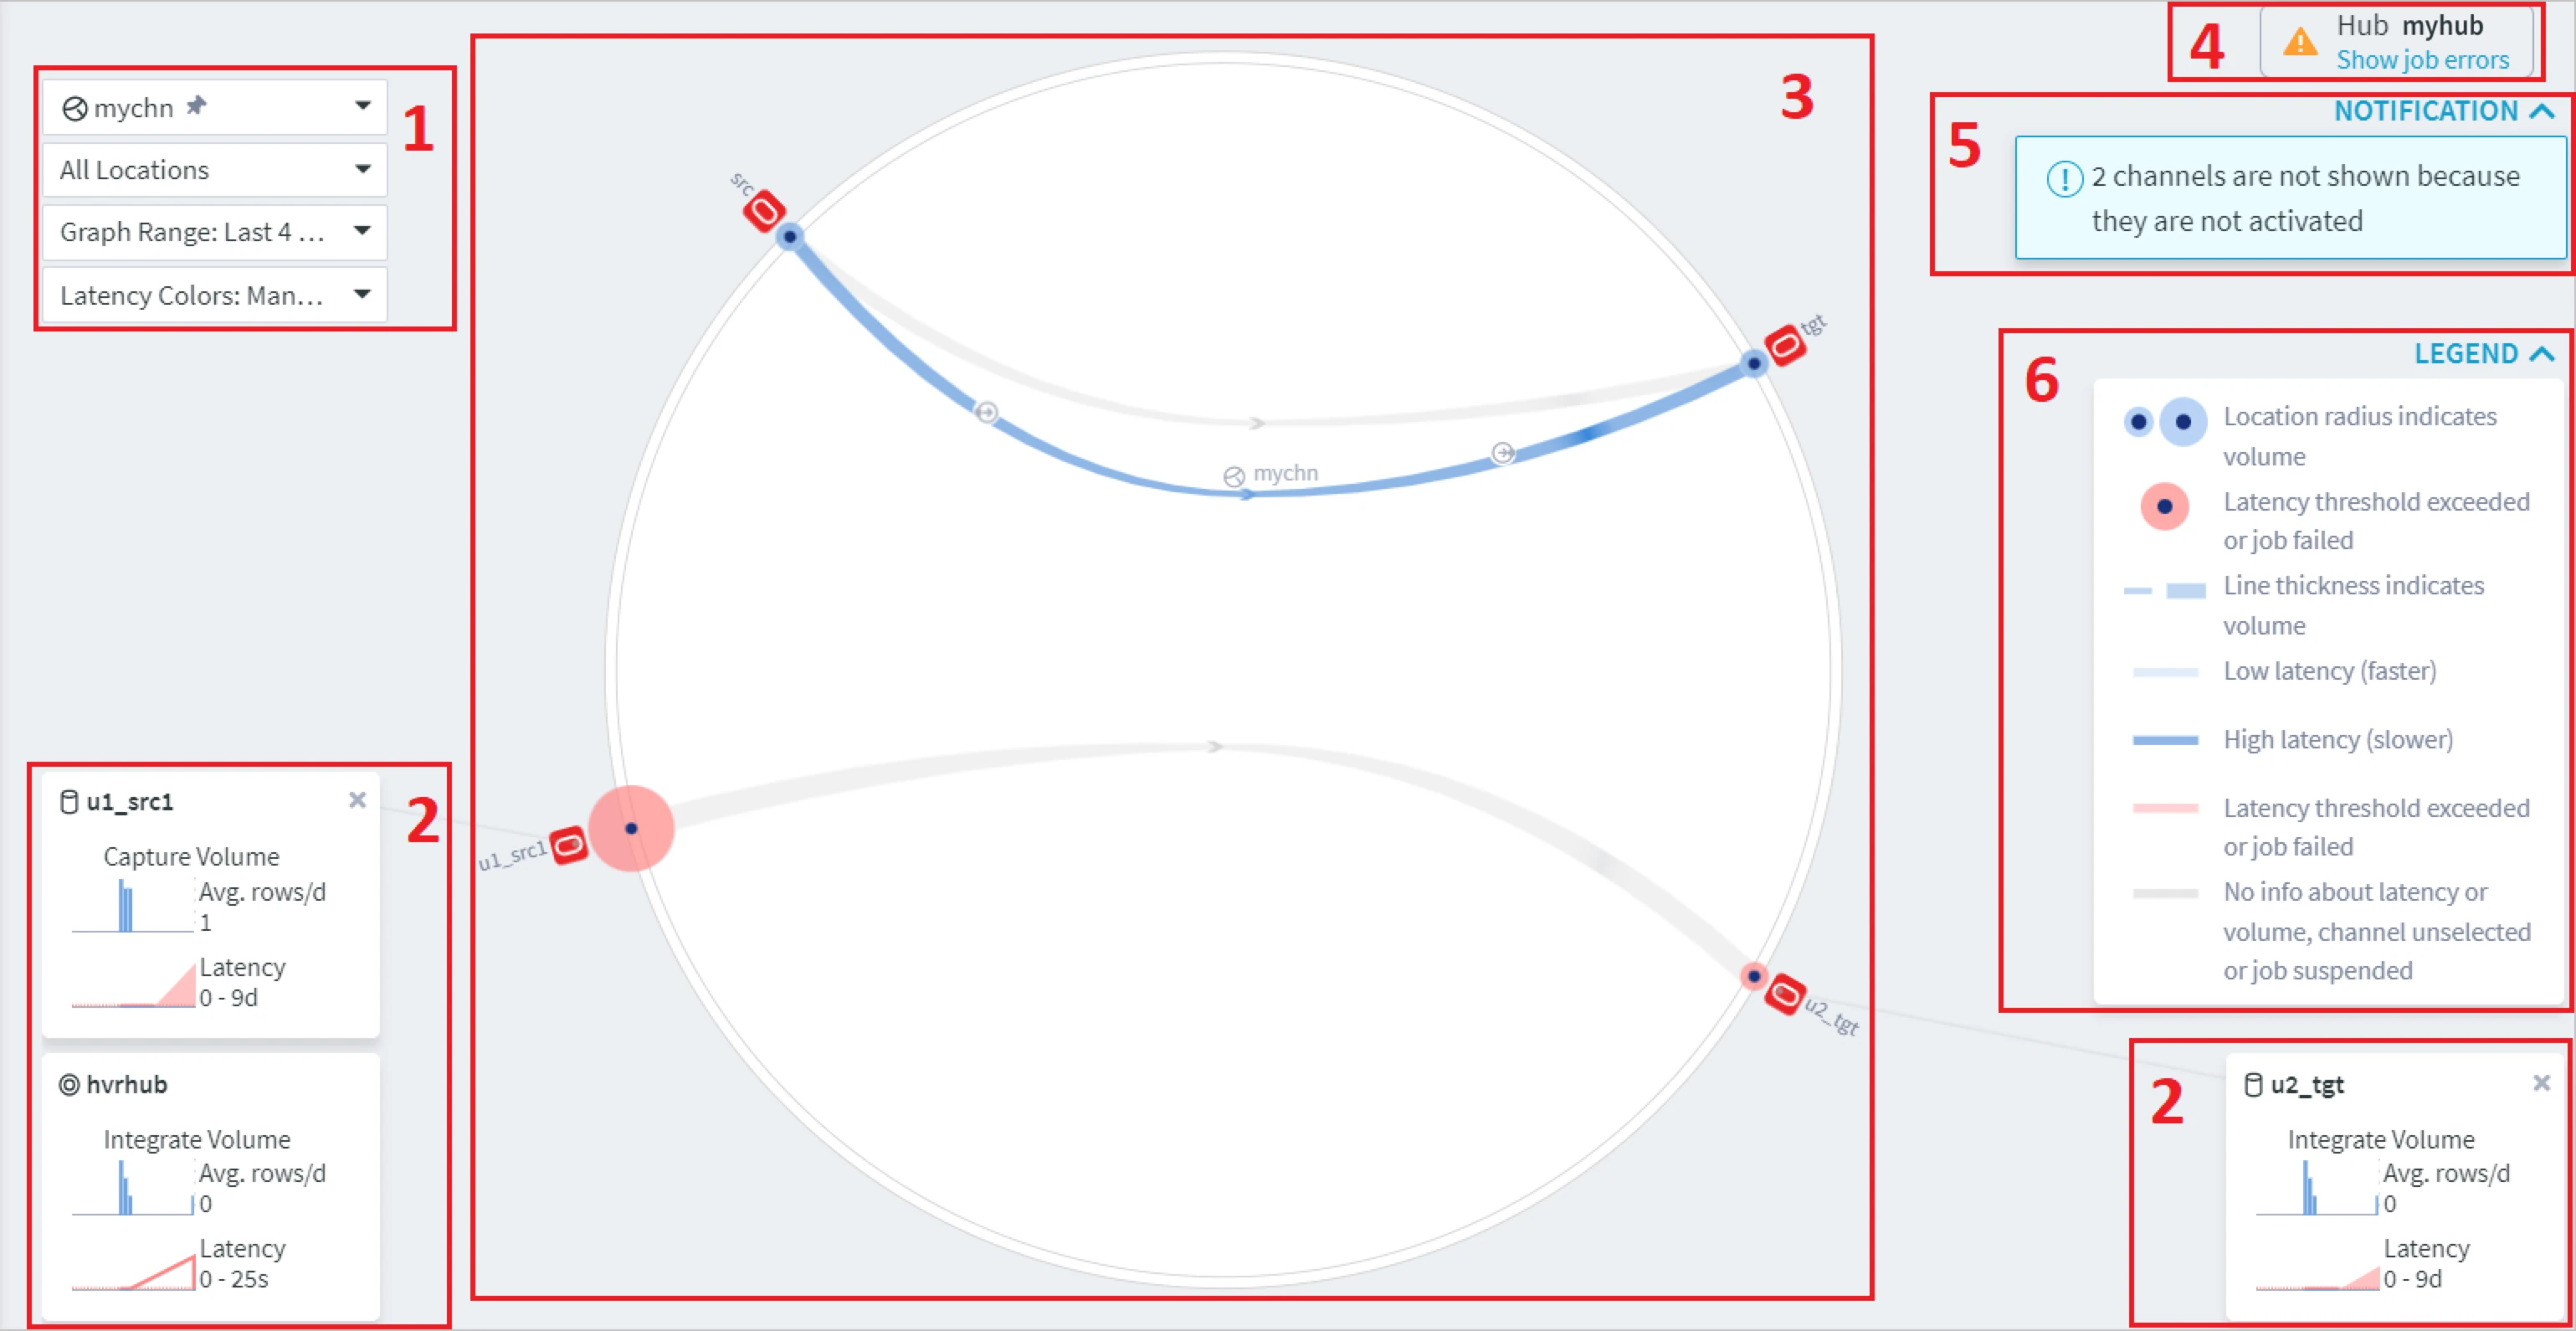
| Number | UI Element | Description |
|---|---|---|
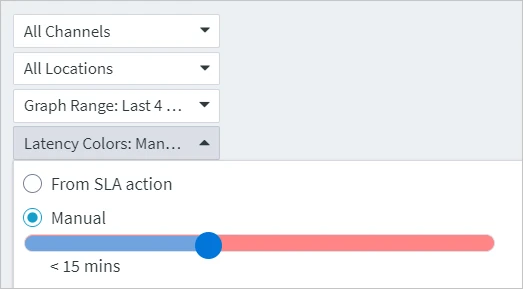
| 1 | Scope | The Scope includes a set of filters allowing to inspect historical metrics for each location or channel individually. The following filters are available:
|
| 2 | Live status card | Displays the performance metrics for the respective element selected in on the Topology graph. For more information, see section Live Status Card. |
| 3 | Topology | Graphical representation of locations and channels with activated replication, as well as the direction of data flow in channels, replication data volume and latency. The color and thickness of lines and location radii are explained in the LEGEND drop-down box. |
| 4 | Hub | Name of the hub for which the topology is displayed. |
| 5 | Notification | Show/hide notifications for the topology view. |
| 6 | Legend | Show/hide description for the colors and icons displayed on the Topology graph. |
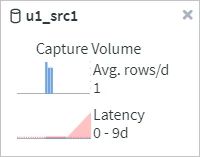
Live Status Card
A live status card displays live statistical metrics for the element selected in the topology view. By default, only the hub live status card is displayed. Only two metrics can be displayed at a time in the live status card and this can be configured on the Topology Preferences pane under VISIBLE METRICS. Clicking the live status card opens the Statistics page for the respective element.
Live status card is supported for the following elements:
- Hub
- Channel
- Capture job
- Integrate job
- Capture location
- Integrate location
- Bidirectional location
Icons
On the Topology page, elements involved in replication are represented by the following icons.
| Icon | Description |
|---|---|
| Indicates a hub. | |
| Indicates a channel. | |
| Indicates a database location. | |
| Indicates a file location, directory or temporary file. | |
| Indicates a Kafka location. | |
| Indicates a capture or integrate job. | |
| Indicates the direction of replication. This icon is displayed in red color if the latency threshold is exceeded or a job failed. |