Statistics - DSS 6 | Data Source Solutions Documentation
Documentation: Statistics - DSS 6 | Data Source Solutions Documentation
Statistics
The Statistics page offers a centralized and interactive data dashboard with monitoring and reporting features that allow you to track data flow in real-time and get automated error notifications in case something goes wrong. The data dashboard provides an easy view of the most important replication metrics at a minute or even second frequency.

Stats Job
The stats job (dssstats) is responsible for gathering data that is displayed on the Statistics and Topology pages. The stats job is created in a RUNNING state along with the repository tables during the installation of Data Source Solutions DSS. If the stats job is not manually suspended, it will always run whenever the hub server is running.
Information for the stats job is gathered from the following files:
-
Data Source Solutions DSS log files, in which all data from capture/integrate/refresh jobs is written to. The script called dssstats reads information from the log files and pulls them into the statistics system.
-
Router transaction files. These are the files, to which the capture job transports changes from the source location, while the integrate job reads from the router files and applies changes to the target location. The stats job does not read the transaction files, it only counts them and looks at their names.
-
*.cap_state file.
The DSS_STATS repository table is responsible for maintaining statistical data and consists of a number of columns that store statistical information about data replication. The stats job modifies the DSS_STATS table based on the data read from the above files. In particular, the DSS_STATS table includes the metric_name and metric_value columns storing data on a variety of metrics captured by Data Source Solutions DSS, such as capture/integrate latency, captured row counts, integrated change counts. For a complete list of columns in the DSS_STATS repository table and the type of data stored in them, see section Repository Tables.
You can also store the statistics data in a secondary external location separate from the repository database. For more information, see Secondary Storage for Statistics.
Stats Aggregation
The stats job performs two types of aggregations when writing to the DSS_STATS table:
-
Scope aggregation
Metrics are taken from DSS log files and are written to DSS_STATS table at a certain scope defined by a channel name (column chn_name), location name (column loc_name) and table name (column tbl_name), which can be either named explicitly or regarded as '*' (which means applies to all channels, locations, tables).
For example:
There are 5 'captured inserts' with chn_name='chn1', loc_name='src' and tbl_name='tbl1' and 5 for 'captured inserts' with chn_name='chn1', loc_name='src' and tbl_name='tbl2'. The DSS_STATS table will store these values, but it will also store value 10 for tbl_name='*', the sum of both values.
For more information on various scopes that can be defined, see option -s of command dssstats showing how the aggregation behaves with different scopes.
-
Time granularity aggregation
Metrics are gathered/output with a per-minute granularity. That is, the value of captured inserts for one-minute granularity means the number of rows inserted within that minute. These values can be aggregated up to 10 minutes, 1 hour, and 1 day. For more information on the time granularity option, see option -T of command dssstats.
There are also different types of aggregation functions. Some metrics are aggregated with the sum function, others - with the min or max functions.
Stats Purging
For the DSS_STATS table to stay in a reasonable size, the data needs to be purged from that table. By default, automatic purging of the statistics data from the DSS_STATS table is enabled for a hub. This can be configured using the option RETENTION POLICY in Statistic Tuning or by using the hub property Statistics_Retention_Policy.
To purge the statistics data immediately (as a one-time purge) from the DSS_STATS table, use the command dssstats (with option -p).
Secondary Storage for Statistics
Regular purging of data from the DSS_STATS table removes the older information. To preserve the statistics data even after purging, you can store it as CSV files in an external location, separate from the repository database.
To store the statistics data in an external location, you need to define the hub property Statistics_Second_Location and specify the directory path to save the CSV files using the dsshubconfig command:
dsshubconfig <em>hub</em> Statistics_Second_Location=<em>directory_path</em>Replicating Statistics Data
You can replicate the statistics data from the secondary storage location to any destination, such as a database or another server. After defining the hub property Statistics_Second_Location, you need to set up a channel containing a source location configured with the secondary storage path and a target location into which you want to replicate the statistics data.
Perform the following steps to set up a channel using the sample channel definition (dss_stats_channel_example.json) available in the DSS_HOME/examples/dss_stats directory:
- Import the sample channel definition. For instructions on importing a channel, see Importing Channel Definition.
- In the imported channel (export_stats), edit the source and target locations -- Source location: 1. Open the [source location details](/docs/dss6-user-interface-locations-location-details) page. 2. Click **Edit** on the **File Connection** pane. 3. Specify the directory path of the secondary storage location in the **DIRECTORY** field. This must be the same directory path defined in the hub property **Statistics_Second_Location**. 4. Click **Save**. 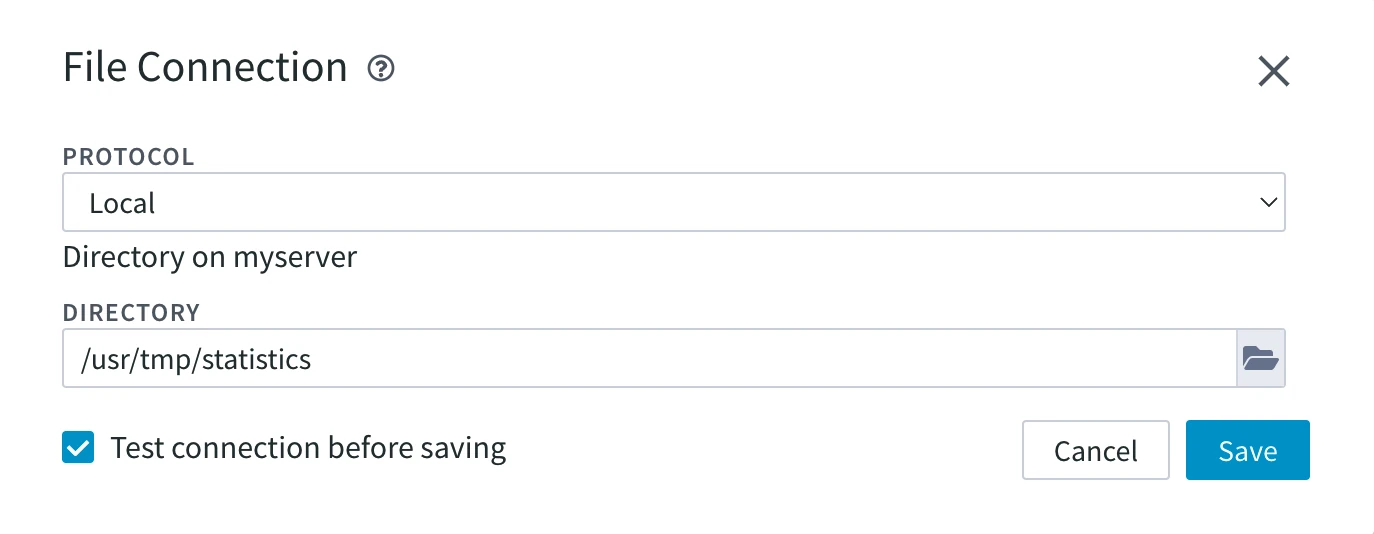 - Target location: 1. [Delete](/docs/dss6-user-interface-locations-deleting-location) the sample target location. 2. [Create a new target location](/docs/dss6-user-interface-locations-creating-location) where you want to replicate the statistics data. 3. Go to the [**Table Details**](/docs/dss6-user-interface-tables-table-details) page for the **dss_stats** table. 4. Click the **More options** menu  at the top right and select [**Create/Alter Target Table**](/docs/dss6-user-interface-tables-creating-or-altering-target-tables). 5. In the **Create Target Tables that Are Missing** dialog, ensure that the **Alter or Recreate any Existing Table whose Layout is Incorrect** option is selected. 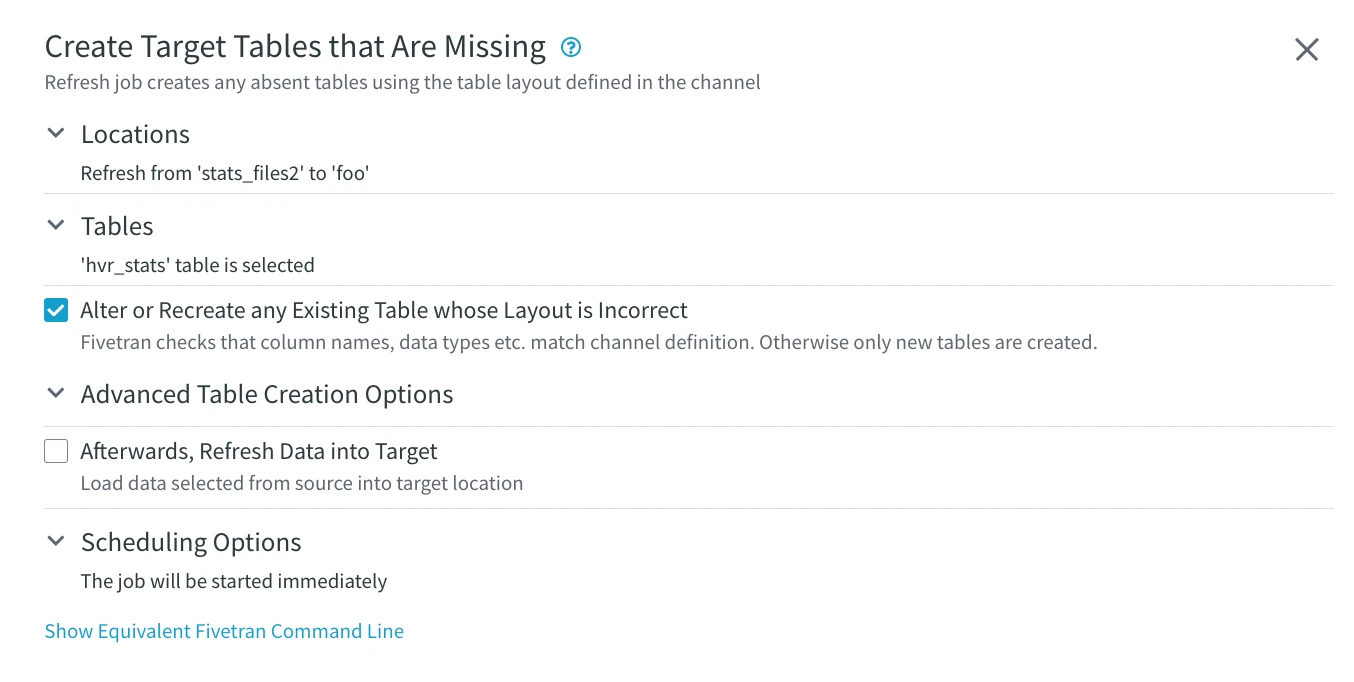 6. Click the **Create or Alter Target Tables** button at the bottom of the dialog. This creates the table in the target so that data can be written into it. 7. Go back to the [**Channel Details**](/docs/dss6-user-interface-channels-channel-details) page and run [**Activate Replication**](/docs/dss6-user-interface-channels-activating-replication).
By default, the sample channel contains a source File location and a target Oracle location.
Viewing Statistics in the User Interface
To open the Statistics page in the user interface, navigate to the left sidebar and click STATISTICS.
The Statistics view contains the following user interface elements.

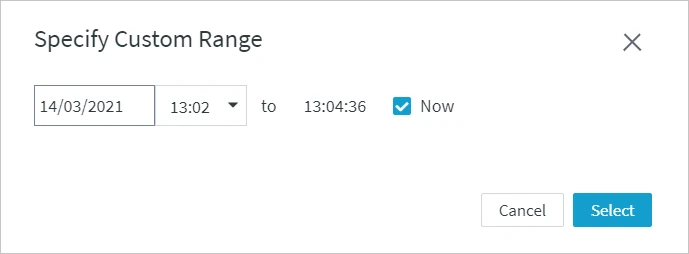
Number UI Element Description 1 Scope Allows to inspect historical metrics for a specific channel, location or table. 2 Graph Range Allows to select a time period, for which metrics are shown. You can select the time range from the available ones (such as 'Last 10 min' or 'Last 7 days') or you can specify a custom time range by clicking Specify range and selecting the start date/time and end date/time in the Specify Custom Range dialog.
Another way to select a custom time period is to select it on the graph itself by clicking and dragging your mouse from the start time point to the end time point. The graph will then automatically zoom in to the selected time period. The selected time range will be applied to all graphs available in the dashboard.
For example, to view statistics from June 25 to June 27, click and drag your mouse on the graph as shown below.

3 Metrics Displays the selected metrics graph in the dashboard or hide the unselected one. For more information on the available metrics, see section Graphs and Metrics. 4 Hub Name of the hub for which the statistics is displayed. 5 Options The set of options to manage each graph:
- Split: Create a graph using the selected Metric and Scope (by Location, by Channel, or by Table/Channel). In the Split drop-down, you can select a Metric available in the graph and split it by Scope. The split graph will be inserted next to the graph containing the metric you want to split.
- Rate unit: Display the number of changes per a selected time unit on the left side of the graph. Click the menu icon
 to set this option.
 - Λ: Expand/collapse graph (when collapsed, only the graph header is displayed).
- X: Remove the graph from the dashboard.
6 Metrics Legend Indicates the metrics available on a corresponding graph. Each graph displays different metrics. For more information about the statistics metrics, see Metrics for Statistics.
- MORE: Display more metrics on the graph.
- LESS: Display less metrics on the graph.
- SELECT: Select particular metrics to be displayed on the graph. This option is shown only when a graph has more than 5 metrics associated with it.
Graphs and Metrics
The dashboard contains graphs displaying key performance metrics in your replication environment, such as latency, data volumes, and others. Following are the default graphs displayed on the Statistics page. For a complete list of metrics and their description, click the corresponding link in column List of Metrics.
Graph Name Description List of Metrics Latency Displays the latency information for capturing and integrating changes (Latency Stats Metrics). Latency is the time (in seconds) taken for a transaction committed on the source system to be replicated (or committed) on the target system. This graph allows you to analyze the delay in data replication. Latency Stats Metrics Captured Changes Counts Displays the total number of changes captured. Captured Row Counts Stats Metrics Integrated Change Counts Displays the total number of changes integrated. Integrated Change Counts Stats Metrics Integrated Changes (split by Table/Channel) Displays the total number of changes integrated. This is basically an Integrated Change Counts graph which is split using the metric Integrated Changes and scope Table/Channel. Integrated Change Counts Stats Metrics The following metrics graphs can be added under the Metrics selector. For a complete list of metrics and their description, click the corresponding link in column List of Metrics.
Graph Type Description List of Metrics Router Latency Displays the latency detected in router files. Router Latency Stats Metrics Transactions Displays the total number of transactions. Transactions Stats Metrics Durations Displays the time taken for replication in seconds. Duration Stats Metrics Integrate Burst Duration Average Displays the average duration of burst integrate cycles. Integrate Burst Duration Average Stats Metrics Speed Displays the speed of replication. The unit of speed is indicated by the number of captured and integrated rows per a selected unit of time (see option Rate unit above). Speed Stats Metrics Cycles Displays the number of Capture and Integrate cycles. Cycles Stats Metrics Performance Since v6.1.0/31Represent system-level performance measurements for machines running the DSS Hub and DSS Agent. For additional details on performance metrics, including instructions on enabling and disabling them, see section Performance Metrics.Performance Metrics Byte I/O Displays the size of captured row data and files in bytes before and after compression. Byte I/O Stats Metrics Compression Displays the compression ratio for row data. Captured row data is compressed when sent from the capture location to the hub and from the hub to the integrate location. Compression Stats Metrics Replicated Files Displays the number of replicated files during file replication. Replicated Files Stats Metrics Errors/Warnings Displays the total number of errors and warnings. Errors/Warnings Stats Metrics Router Rows Displays the total number of rows in the transaction files. Router Rows Stats Metrics Router Bytes Displays the total size of the transaction files in bytes. Router Bytes Stats Metrics Router Files Displays the total number of transaction files. Router Files Stats Metrics Job Breakdown Displays capture and integrate job time breakdown. Job Breakdown Stats Metrics
-